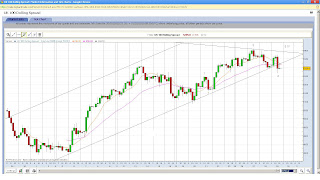

Ok this is getting ever more confusing, it could really go either way.
The 2nd descent today has questioned whether this can rally towards 5600. The drop today has seen the FTSE break slightly out of the upwards channel it has been in since the 5th July.
I still think theres one more high left in this but it looks like waves 1 to 4 done so a top could be in in the low 5400s. Also note 13th May, wave 4 of lesser degree area. so the retrace for wave 2 could be 61.8 rather than 79%. One other way i see this going to 5600s is if we have a 5th wave extension but again that drop today has messed up that count, the drop is too low in my opinion for this to work. Then there is the ending diagonal in Wave 5 of C position which might have started, this is something to keep and eye out for.
If this is Wave 4 of C, its retraced wave 3 by 50% and as long as it doesnt go into wave 1 area, the count upwards is still ok. If wave 5 equals wave 1 (starting 20 July) then again we finish near the 61.8% retrace mark for wave 2 up. One other interesting observation ive noticed are the fibs. If wave 2 does finish around the 5400 area it would mean wave A of the zigzag up is 1.618% length of wave C. dont think ive seen that before.
From a technical perspective, 200ma on daily seems like its having none of the bull and it seems to be bouncing off that area. also take the highs of 16th and 26th april and draw a line down to see the FTSE bounced off that area. Another test of that line could see a failure just below 5400
No comments:
Post a Comment