Trading Analysis based purely on Price Action as taught by Nial Fuller at www.learntotradethemarket.com. All I post here are setups which i see fit to trade win or lose.
Thursday, 5 August 2010
FTSE Analysis
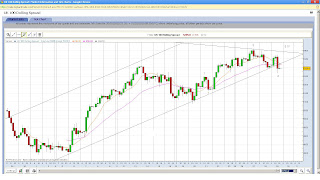
Well, it failed in the 5400 region... AGAIN and does look like a top is being formed. There is one count that i havent mentioned which looks good on the dow but i thought not too good on the FTSE, i maybe wrong. This is the expanded flat wave 2 count. The fibs seem to be fitting pretty well on this.
Take the 1st July to 14th July top as Wave 1 of c being 519pts. Now if Wave 3 is 0.618 in length of wave 1 we get 320pts. Take the top of wave 3 on 27th July to the start of wave 3 on 20th July and its 324pts. Thats close enough to count as a 0.618. Now if Wave 5 which i guess we're in now is 0.618 of Wave 3 it equals to 200pts. Take the start of wave 5 on 30th July and add 200pts we get 5438.
5438 is again a significant number as its the 0.618 retrace of the drop which started on 15th April. And what do Wave 2's normally retrace Wave 1 by??? yes, 0.618!!!
Well, its just some ratio analysis which fits well this count. So tomorrow could be a classic buy the rumour sell the news situation ahead of NFP.
Wednesday, 4 August 2010
FTSE Analysis
All 3 counts mentioned on the last post are still valid but it is looking ever more bullish for the time being.
The double top count is still in due to the fact we keep getting failures at the 5400 area. However todays dramatic reversal and ABC formations on the bigger scale suggest more upward movement. Count #2 from the previous post, the zigzag would just have one more 5 wave movement up. in the c wave from 30th July, if c is to equal A we would fall short near the 5500 area above the .618 retrace of wave 1
If this is Count #3 ending diagonal (ED), i would think we're in the 3rd wave up with one more high before a short break for wave 4. Wave 3 would be shorter than wave 1 if it is a ED. But its important to keep in mind that its very rare ED's occur in C wave position (according to the EWP book that is!)
Monday, 2 August 2010
FTSE Analysis
Theres potentially 3 different counts on the FTSE at the moment.
Count Number 1
The Double Top, which is where we are at the moment. From the 20th July low is a clear zigzag formation upwards. From Fridays low we've also had 5 waves up. The 1st wave on the 20-21st July is pretty much equal in points to the 5th wave up we had from late on Friday. So theres a possible truncation scenario here as theres roughly 5 failures around this mark.
Count Number 2
We're in the final stages of a zigzag correction up. Tomorrow could see a slight correction from todays overbought conditions. If this is the case and a temporary top is in, the count would be going into B of C of C of 2/B. Will be looking for a drop potential to the 5362-5371 area.
Count Number 3
This is pretty much similar to Count Number 2 but the C wave up starting from the 20th July low would be a ending diagonal in C wave position. Now as we know these are pretty hard to call in EWT terms if you stick to all the rules. The rise right now would be wave 3 of C.
If i had to choose a count, id be spilt between counts 2 and 3 at the moment. I think the weekly stochastics need to go a bit more higher for a decent sell off to occur.
The dollar is getting pretty overbought, cable hit .618 of the drop it had recently on the daily chart. USD suggests a turn is very near.
As a general guide on the weekly charts i sometimes look at the number of candles each particular wave does. corrective waves candles as a guide (doesn't happen all the time) start to turn after reaching the number of candles of the previous wave. For example, from the April, on Daily we had 12 candles as part of the whole wave which went down. Now counting upwards from W27 July we're in the 6th candle up, which is half of the candles that did the first drop. Something to keep an eye on here for potential turns
Thursday, 29 July 2010
FTSE Analysis
Ok this is getting ever more confusing, it could really go either way.
The 2nd descent today has questioned whether this can rally towards 5600. The drop today has seen the FTSE break slightly out of the upwards channel it has been in since the 5th July.
I still think theres one more high left in this but it looks like waves 1 to 4 done so a top could be in in the low 5400s. Also note 13th May, wave 4 of lesser degree area. so the retrace for wave 2 could be 61.8 rather than 79%. One other way i see this going to 5600s is if we have a 5th wave extension but again that drop today has messed up that count, the drop is too low in my opinion for this to work. Then there is the ending diagonal in Wave 5 of C position which might have started, this is something to keep and eye out for.
If this is Wave 4 of C, its retraced wave 3 by 50% and as long as it doesnt go into wave 1 area, the count upwards is still ok. If wave 5 equals wave 1 (starting 20 July) then again we finish near the 61.8% retrace mark for wave 2 up. One other interesting observation ive noticed are the fibs. If wave 2 does finish around the 5400 area it would mean wave A of the zigzag up is 1.618% length of wave C. dont think ive seen that before.
From a technical perspective, 200ma on daily seems like its having none of the bull and it seems to be bouncing off that area. also take the highs of 16th and 26th april and draw a line down to see the FTSE bounced off that area. Another test of that line could see a failure just below 5400
Tuesday, 27 July 2010
FTSE Analysis
Seems like the bulls require a short breather before they carry on their climb towards 5600
2 counts here, are we still in a of C of 2 up or has b of c begun?
for the b of c count, we've done 5 waves up and were very overbought today before coming down. the drop has given us a abc down, then a sideways ascending triangle for a possible wave B. If a = c then we go low 5300s, which is also wave 4 of lesser degree area and in between 23.6 and 38.2 retrace
For the a of c count still to carry on higher, we retrace as per above, maybe even shorter before going higher again. with this count wave 3 is 1.618 of wave 1 pretty much bang on
Sunday, 25 July 2010
DAX Analysis
While the other global indices have been showing a certain bear count, the Dax has perplexed and not made any impulsive move down. The same couldve been said back in late 2007 when the other indices dropped a couple of months ahead of the Dax before the Dax joined the bear party.
Any resistance at the highs and well...the same could well be happening again....
Sunday, 13 June 2010
Dow Analysis
Couple of counts going here but there seems to be some debate as to whether this is a wave 2 or a wave 4. There is a lot of sideways movement which could suggest this is a wave 4 which is either a Flat or a triangle.
The chart with the Flat ewt pattern could suggest we're on a wave 4. You would however have to discount that huge wild spike drop on 6th May as w4 would go into w1 territory.
The count i was following last week needs 10315 to hold or that is not a 1 of 3 down. If it goes higher than this, i suspect a bigger wave 2 retrace is under way and could be heading higher possible to the 10600s
Friday, 11 June 2010
LIVE TRADE - FTSE
Long FTSE July 5178. This is a hedge bet against the shorts i have running. looking for this is run to the top of the channel, charts later
Thursday, 10 June 2010
Wednesday, 9 June 2010
Tuesday, 8 June 2010
Monday, 7 June 2010
Sunday, 6 June 2010
Dow Analysis - EWT Count 3
This is the third count and seems favourite in my opinion. The count here would be we're in the 3rd wave of major wave 1 down. 3 of 3 of 1 of P3
The others indices seems to back this count up too with the FTSE and Dax playing out a very similar scenario. Also we have a 3 candle swing on the daily chart which suggests carnage is right round the corner
Dow Analysis - EWT Count 2
This has been my primary count but i find it in serious doubt now. The current count would suggest we're in a wave 2 correction and the drop would be Wave B down, possibly even testing the lows as a Flat. But the strength of the drop has left doubts in my mind to as to whether this is a B wave. Also the break down looks like a bear flag broken which is likely to lead to steeper drops
Dow Analysis - EWT Count 1
Friday, 4 June 2010
LIVE TRADE - GBP/USD - closed
Limit hit 100pips profit (at fligging last!)
Will post some Dow counts and maybe others if i have time over the weekend. have 3 possible counts and the bears seems in control
Thursday, 3 June 2010
Wednesday, 2 June 2010
Dow Analysis
Saturday, 29 May 2010
Dow ALT Count
Friday, 28 May 2010
Dow Analysis
Thursday, 27 May 2010
Dow Analysis
Im sorry ive barely had time to do analysis these past few months but im looking to get back into this more now.
The graphs illustrated are assuming P3 is under way. The DJIA count shows as the first 5 waves down complete to complete wave 1 of 5 of 1 of P3. im expecting a rally towards 50% to 61.8% of Wave 1 in the form of a zigzag. There is a danger we get a 79% retrace as there is a wave 4 of lesser degree there too.
In the short term Wave A of the zigzag is complete. A 50% retrace of Wave A for Wave B would take it near wave 4 of lesser degree at around low 10000s. Will see if this pans out tomorrow
If the markets stay as volatile as they have been in the past few weeks, expect wild swings both ways, looks very toppy the charts just as when P1 started
Tuesday, 18 May 2010
Monday, 17 May 2010
LIVE TRADE - AUD/GBP
Long again at 6063. stop at 6015, limit 6163
Reason for trade is bull flag still intact on weekly and we have bounced off the upper channel. nice bull flag on 2hr too
Friday, 14 May 2010
LIVE TRADE - NZD/GBP
Long 4864. stop 4767, limit 4939
Reason for trade - swing trade setup on daily chart, adx 41, strong on daily.
LIVE TRADE - AUD/GBP
Long 6099, stop 6030, limit 6199
Reason for trade - swing trade setup on 4 hour and bull flag on weekly chart has broken
Monday, 10 May 2010
LIVE TRADE - EUR/GBP
Stopped out for 39pips
annoyingly went 10pts higher than my stop and came crashing down....
Sunday, 9 May 2010
Wednesday, 5 May 2010
Monday, 3 May 2010
LIVE TRADE - ORDER
To short the FTSE daily at 5566. Stop 5586, Limit 5500
Huge contracting triangle suggests we're coming to the end of a 3rd wave or a C. If its a C then or rock and roll on upwards.
Sunday, 2 May 2010
LIVE TRADE - NZD/USD
Long June contract at 7278. Stop 7224, Limit 7328
Reason for trade, the big bear flag on the weekly chart has broken. looking for it to hit support level at the 7328 area
Friday, 30 April 2010
LIVE TRADE closed
FTSE short got triggered at 5560 June. Just closed at 5485 for 75 pips profit. Bear flags - gotta love em!
Thursday, 29 April 2010
LIVE TRADE - ORDER
to short ftse june at 5560. limit 100 stop 5611
this order will trigger if the bear flag on 2hr chart breaks
LIVE TRADE - AUD/GBP
Long from 6053. stop 6025. Limit 6153. Still wanting that break upwards
Order got triggered from last night and lost 15 pips
Wednesday, 28 April 2010
LIVE TRADE - ORDER
Tuesday, 27 April 2010
LIVE TRADE closed
Long Dax June 6276 stopped out at 6176 = -100pips
Im really fuming at the state of this trade, was 29pips off my limit then boom, news out about greece and portugal and stop was hit in no time. Did actually think about banking what i had yesterday but thought id let it run for a test of the top, how i regret that now.
Monday, 26 April 2010
LIVE TRADE closed
NZD/GBP closed for 8pips profit, will consider re-entering again after the contracts have rolled over
Friday, 23 April 2010
NZD/GBP Analysis
LIVE TRADE closed
Sorry didnt post yesterday when this occured so not quite live but FTSE June long stopped out, -106pips :-(
Possible swing trade setup happening on FTSE daily again but will see after 9pm
Dax long still running and around the b/e mark
Possible swing trade setup happening on FTSE daily again but will see after 9pm
Dax long still running and around the b/e mark
Tuesday, 20 April 2010
Friday, 16 April 2010
Wednesday, 14 April 2010
LIVE TRADE - Swing Trades
Long AUD/JPY June 10 at 8663. Stop 8472. Limit 8763
Short EUR/AUD June 10 at 1.4684. Stop 1.4850. Limit 1.4584
Monday, 12 April 2010
LIVE TRADES - Closed
USD/CHF - Limit hit 56pip profit
EUR/GBP - Closed for 10pip loss
GBP/USD - Limit hit for 43pip profit
EUR/USD - Stopped out for 41pip loss
EUR/GBP - Closed for 10pip loss
GBP/USD - Limit hit for 43pip profit
EUR/USD - Stopped out for 41pip loss
Sunday, 11 April 2010
LIVE TRADE
two more
Short cable 1.5460, limit 1.5417, stop 1.5486
Short eur/usd 1.3644, limit 1.3575, stop 1.3685
Short cable 1.5460, limit 1.5417, stop 1.5486
Short eur/usd 1.3644, limit 1.3575, stop 1.3685
LIVE TRADES
These are half gap trades. After the greece bailout figure sum had been confirmed today, theres big gaps all over forex pairs. Trying to get in on some of the gaps while its overbought/oversold
Short eur/gbp 8863. Limit 8797, Stop 8863
Long usd/chf 10559.6. Limit 10615, stop 10529
Short eur/gbp 8863. Limit 8797, Stop 8863
Long usd/chf 10559.6. Limit 10615, stop 10529
Tuesday, 6 April 2010
EUR/USD Analysis
Long Term Chart - I previously had this as a wave 4 triangle but looking at it, it looks more like a big B wave playing out. I had 12853 as a turning point for the C wave which is 61.8 of Wave A in price. Theres also strong support around that area.
The alternative count is we've had or near enough had 5 waves down to complete the first wave down.
Monday, 5 April 2010
LIVE TRADE - GBP/USD - closed
For 15244.8 = 21pips profit. Limit missed by a whisker overnight so am taking profit while its there (trying to learn from previous mistakes!)
Sunday, 4 April 2010
LIVE TRADE - GBP/USD
This is for a gap fill after the rise tonight., only looking for 50pips. Stop 15306. Limit 15216. Entry 15266
Thursday, 25 March 2010
FTSE EWT Analysis
This is the FTSE expanded flat Primary wave 2 count on the weekly chart. The count i have is we're in the 5th wave up of the C wave which began at the March lows in 09. Of that 5th wave, i have 3 of 5 done. We now drop for the 4th wave before the final 5th wave up takes it to the 6000 mark, and top of the weekly channel.
If this is indeed a 4th wave correction starting today i have 5500 as a potential 38.2 retrace of wave 3 target. We'll see how it falls though cos again we could be topping P2. (again famous last words) The chart looks like a similar scenario to when we topped on 2007, so the way we drop will give clues as to whether P3 has actually started
Possible FTSE Trade
Tuesday, 23 March 2010
LIVE TRADES - Closed the lot
This market is a bubble which is getting bigger and bigger and it will burst, but not right now
Dow Year End open at 9837 closed at 10708 = -871pts
Dow Year End open at 10249 closed at 10709 = -460
FTSE June open at 5500 closed at 5641 = -141pts
FTSE June open at 5513 closed at 5641 = -128pts
Amateur trading at its best
Dow Year End open at 9837 closed at 10708 = -871pts
Dow Year End open at 10249 closed at 10709 = -460
FTSE June open at 5500 closed at 5641 = -141pts
FTSE June open at 5513 closed at 5641 = -128pts
Amateur trading at its best
Monday, 22 March 2010
LIVE TRADE - EUR/USD order
Not had time to do any charts today but looking at it, 1 of 5 of over and we are in 2of5 up. Im looking at a 38.2 retrace back to the 13600 mark and wave 4 of lesser degree. Order in to to short at 13600, stop 13800, limit will see ;-)
Friday, 19 March 2010
EUR/USD Long term chart
Theres a possible 4th wave triangle playing out, which could lead to dollar weakness later this year. Now if we apply some EWT rules to this triangle we could work out some turning points. C waves retrace roughly 61.8 of Wave A in triangles. That gives a figure of 12853. This also could lead to a bounce of the 2005 and 2008 low support line.
How gutted am i......
The euro trade didnt trigger by the spread, missed out on the 100+ pip drop, typical.....
Thursday, 18 March 2010
EUR/USD Support & Resistance
LIVE TRADE - EUR/USD stopped out
Order triggered overnight and stopped out overnight, -30pips, didnt even get to see the trade :-(
If the low trendline at 13660 gets breached then the 5th wave confirmation down couldve well started
Wednesday, 17 March 2010
EUR/USD EWT Analysis
The ending diagonal drawn out yesterday seems to have developed well having bounced off the upper diagonal resistance. The current downleg which im counting as a wave 4of c i have as going to low 13700s before making one more high to complete the diagonal.
In Contracting traingle wave 2 and 4 usually retrace .66 to .81% of the preceding wave. Wave 2 did 61.8%. Wave 4 if it does 61.8 of wave 3 is 13719. I have the bottom diagonal resistance line at 13709.
In the EWT book, the main rules about contracting triangles are:
- Wave 3 is always shorter than wave 1 - TICK
- Wave 4 is always shorter than wave 2 - SO FAR TICK
- Wave 5 is always shorter than wave 3 - STILL TO SEE
- Wave 4 always ends within the price range of wave 1 - SO FAR TICK
So, i am looking to go long at around the 13710 area, looking for 100pts. Again, im going to have to play this by orders as im unable to trade during the day due to work commitments. Stop will be not too far below the rising trendline
LIVE TRADES - Closed
I had some remaining shorts open on the dow and s&p from January and have now closed 3 of them. i have 2 short dow positions open now at low stakes, which i'll decide upon whether to hold or not depending on a overdue correction which i feel is due very very soon Have to say though, the holding game is not working at the moment
S&P June open at 1062 closed at 1162.63 = -100
Dow Year End open at 9810 closed at 10589 = -779pts
Dow Year End open at 10076 closed at 10590 = -514pts
S&P June open at 1062 closed at 1162.63 = -100
Dow Year End open at 9810 closed at 10589 = -779pts
Dow Year End open at 10076 closed at 10590 = -514pts
Tuesday, 16 March 2010
EUR/USD EWT Analysis
Breaking the previous high suggests the the euro/usd pair has a little further to go. The way in which its rising though seems pretty weak so am looking towards the 38.2 retrace of wave 3 for a turning point. Around this area is a strong resistance line also and also the possibility of a ending diagonal.
Will be looking at bounces off the support and resistance lines and see if they fit in with the ending diagonal pattern
Subscribe to:
Posts (Atom)